A tour of your dashboard
What this is for
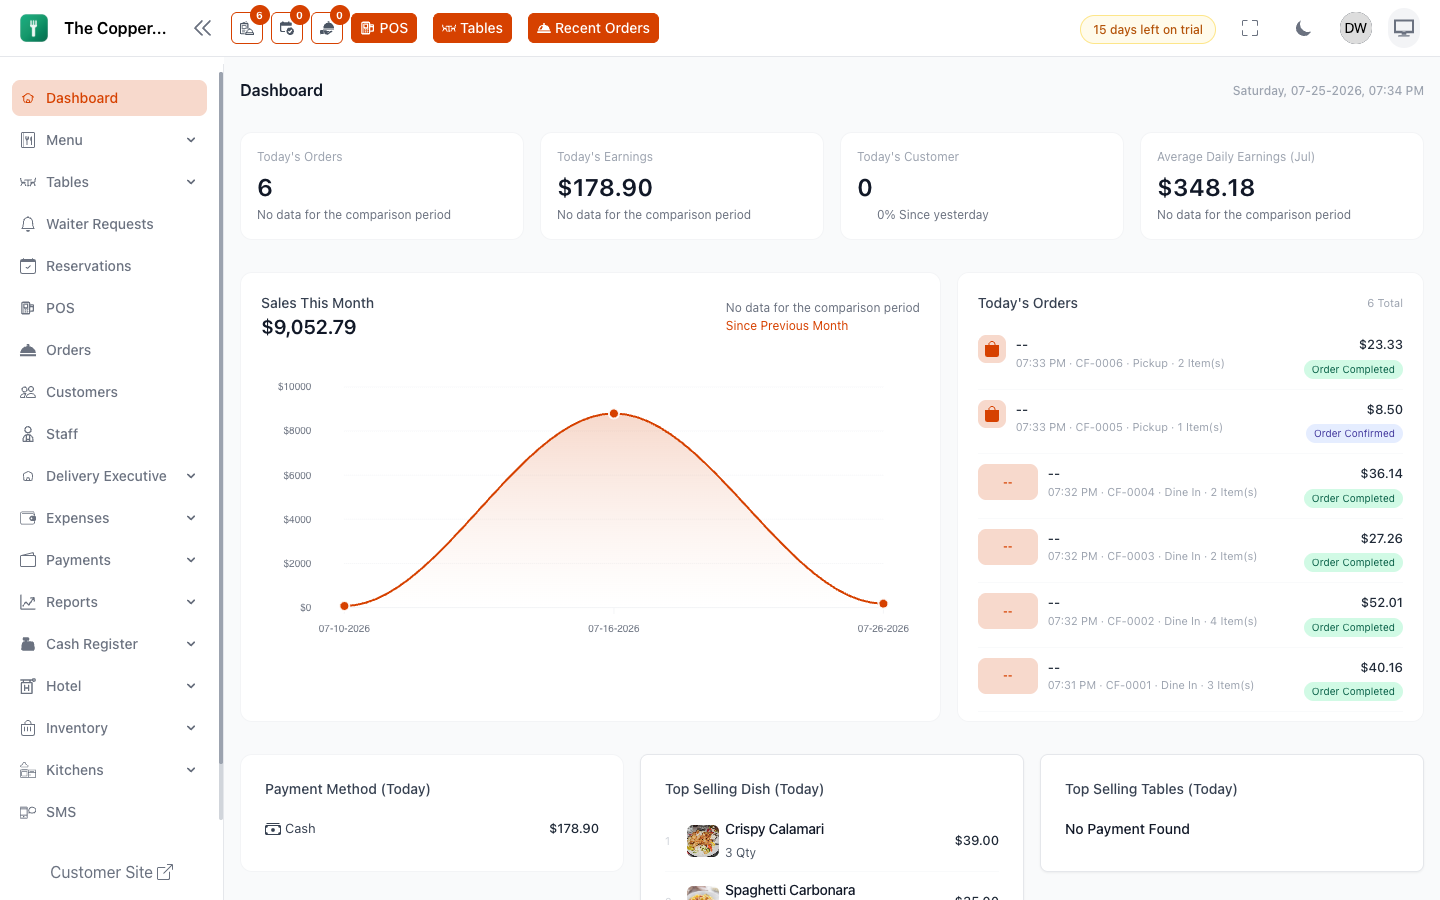
The dashboard is the first screen you see after signing in. It answers one question: how is today going? Everything on it is live — you don't need to refresh.
The numbers along the top
| Panel | What it means |
|---|---|
| Today's Orders | How many orders so far today, with a comparison against yesterday |
| Today's Earnings | What you've taken today, in your currency |
| Today's Customers | How many customers you've served today |
| Average Daily Earnings | Your daily average, compared against the previous month |
The comparisons ("since yesterday", "since previous month") tell you the direction, not just the number. If a comparison shows nothing, there's no data for the earlier period to compare against — which is normal in your first days.
The panels below
- Sales This Month — a chart of how the month is building.
- Statistics — a weekly sales chart.
- Top Selling Dish — what's actually moving. Worth a look before you plan your prep.
- Top Selling Tables — which tables earn most. Useful when you're deciding where to seat people.
- Earnings by payment method — how much came in as cash, card, and anything else you accept.
- Today's Orders — the live list. Select any order to open it.
- Today's Reservations — who's booked in.
- Active Waiter Requests — guests who've tapped the call-waiter button and are still waiting. This one is worth watching during service.
There's also a shortcut straight to the POS, so you can start taking orders without going via the menu.
Good to know
"Today" means your business day, not the calendar day. If your service runs from 6pm to 2am, orders taken at 1am still count towards the night that started at 6pm — which is almost certainly what you want. This is controlled by your operating shifts. If the dashboard totals look wrong by a few hours, that's the first thing to check: see Opening hours and operating shifts.
What you see depends on your role. A waiter won't see earnings figures. That's a permission, not a fault — see Why can't I see this screen?.
Figures are for the branch you're working in. If you have several branches, switch branch to see its numbers. There's no combined view on the dashboard; for that, use the reports.