The sales report
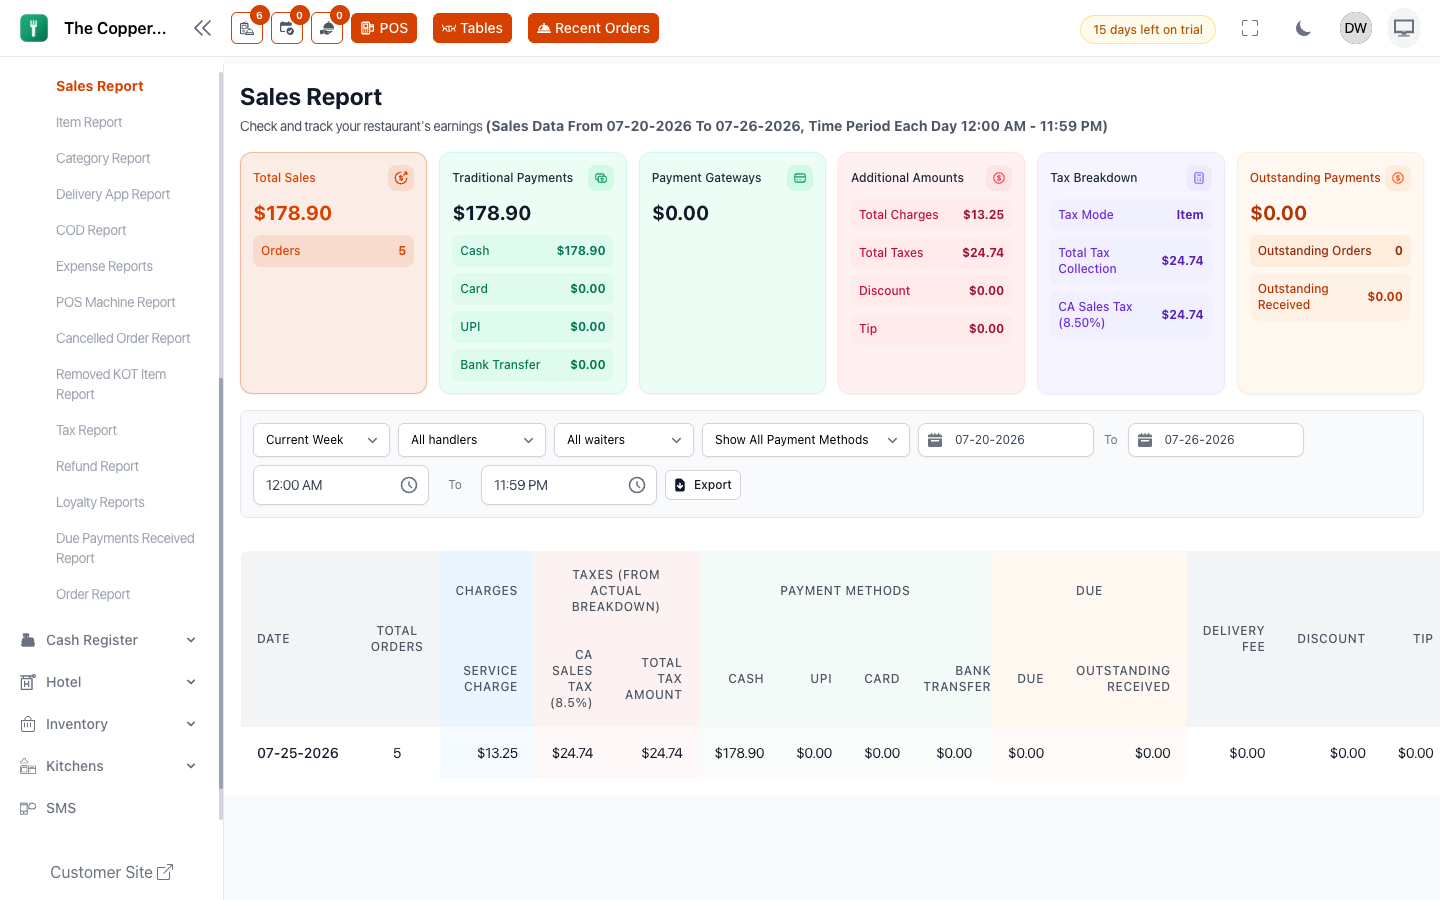
What this is for
Checking and tracking what your restaurant earns. It's the report you'll open most.
The headline numbers
| Figure | What it is |
|---|---|
| Gross Sales | Everything, before deductions. |
| Net Sales | After discounts and refunds. This is the real number. |
| Total Orders | How many. |
| Average Order Value | Net sales divided by orders. |
| Average Items Per Order | How much is in a typical basket. |
| Total Taxes | Tax collected. |
| Total Discounts | Given away. |
| Total Charges | Service charge and the rest. |
| Total Refunds | Paid back. |
| Cash Payments and Digital Payments | The split. |
| Pending Payments | Owed. |
| Cancelled Orders | Stopped. |
Gross against net
Watch the gap. Gross is what you rang up; net is what you kept.
A widening gap means discounts, refunds or cancellations are growing. That's worth knowing well before it shows up in your bank balance, and the three reports that explain it are refunds, cancellations and the discount figure here.
Average order value
The most actionable number on the page.
It moves for reasons you control: whether staff offer a side, where desserts sit on the menu, whether the upsell prompt is on the POS. A 5% lift in average order value with the same number of covers is pure margin — no extra rent, no extra staff.
Track it weekly. It responds to training faster than almost anything else.
The breakdowns
Sales by time
Sales in bands across the day. This is your staffing report.
Read it against your rota. A queue at 12:30 with two people on and a quiet 3 pm with four is a rostering problem that this chart makes obvious.
It's also how you decide whether a lunch service is worth running at all.
Sales by day, month and year
Trade across days of the week, and across longer periods.
Day-of-week patterns are remarkably stable, which makes them useful: they tell you which days to push, which to close, and when to schedule a deep clean or a delivery.
Month and year views are for the trend — is this month better than the same month last year? That comparison strips out seasonality in a way "better than last month" never does.
Sales by category
Which parts of the menu carry the business. See Items and categories for the detail.
Sales by payment method
Split across Traditional Payments — cash, card, UPI, bank transfer — and Payment Gateways, with Additional Amounts shown separately.
Two uses: reconciling the day, and noticing a change. A cash share that drops steadily is a real shift in how people pay, and it eventually changes how much float you need and how often you bank.
Sales by order type
Dine-in against delivery against pickup, and any custom order types you've created.
This is where third-party delivery platforms earn their separate order type — without it, platform revenue at 30% commission is blended with your own at nearly full margin, and the combined figure tells you nothing useful.
Reading it well
- Always compare. Against last week, last month, same month last year.
- Net, not gross. Gross flatters.
- Per-cover, not just total. Sales up 10% with covers up 15% means your average spend fell.
- Watch the gap between gross and net more closely than either number on its own.
Good to know
- The period follows your operating shifts, not midnight — see Opening hours and shifts.
- Reports are scoped to your branch.
- Tips are reported separately from sales, so food revenue stays clean.
- Everything here exports — see Exporting reports.